Violin — Count Distribution
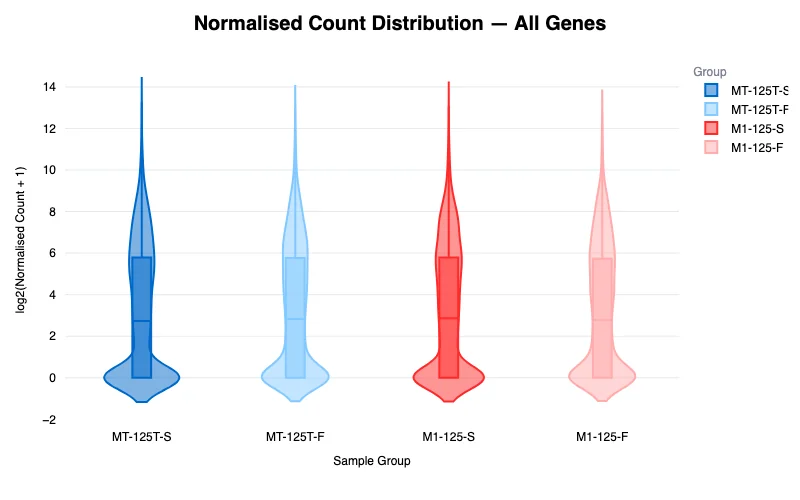
Example output from the sample project.
Header: Violin: Normalised Count Distribution per Sample
The Violin plot presents the same data as the Box plot but uses a density-based visualization that reveals the full shape of each sample's expression distribution. The wider sections of each "violin" indicate where more genes are concentrated at that expression level.
This is particularly useful for identifying bimodal distributions or other non-normal patterns that a box plot might not reveal. The axes and groupings are identical to the Box plot.
Summary Statistics — All Genes (Expandable Table)
An expandable section below the plot provides summary statistics.