DEG by Cell Type — Where the Response Is
Header: 🔥 DEG by Cell Type
Available on single-cell RNA-seq projects.
The DEG by Cell Type tab answers: which cell types actually respond? Rather than one differential expression result for the whole tissue, it runs the contrast within each cell type separately and compares the outcomes side by side.
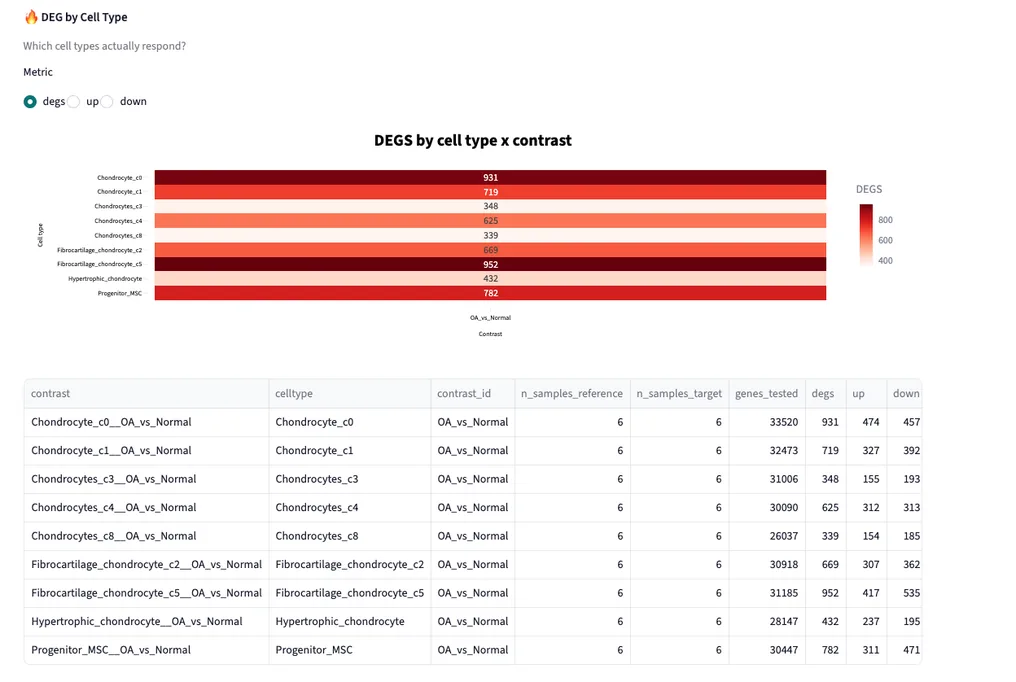
Example output from the sample project.
Metric
A Metric control switches what the heatmap displays:
- degs — all differentially expressed genes
- up — upregulated only
- down — downregulated only
Switching between up and down shows the direction of each cell type's response, which a combined count hides: two cell types with a similar DEG total can be responding in opposite directions.
DEGs by Cell Type × Contrast
The heatmap places cell types on one axis and contrasts on the other, with the count written in each cell and a color scale for quick comparison. The cell types with the darkest cells are where the condition has the strongest transcriptional effect.
Counts here depend on the Adjusted p-value threshold and log2 Fold Change threshold in the sidebar Filters section — move either and the whole heatmap recalculates.
Result Table
The table below the heatmap gives the numbers behind every square:
| Column | Meaning |
|---|---|
contrast |
the full contrast name, cell type included |
celltype |
cell type tested |
contrast_id |
the contrast, e.g. OA_vs_Normal |
n_samples_reference / n_samples_target |
samples on each side of the comparison |
genes_tested |
genes that passed expression filters in this cell type |
degs / up / down |
significant genes in total and by direction |
Check n_samples_reference and n_samples_target before trusting a striking result — a cell type tested on fewer samples carries much less statistical weight, and genes_tested varies by cell type because sparsely expressed genes are dropped.