Pseudobulk Coverage — What Was Tested
Header: 🧮 Pseudobulk Coverage
Available on single-cell RNA-seq projects.
The Pseudobulk Coverage tab answers: was my cell type tested, on how many samples, and if not, why not?
Differential expression on single-cell data is run as pseudobulk: the cells of one cell type in one sample are summed into a single expression profile, and those profiles are compared between conditions. That means the unit of replication is the sample, not the cell — and a cell type without enough samples on both sides cannot be tested at all. This tab makes that explicit rather than leaving it as a silent gap.
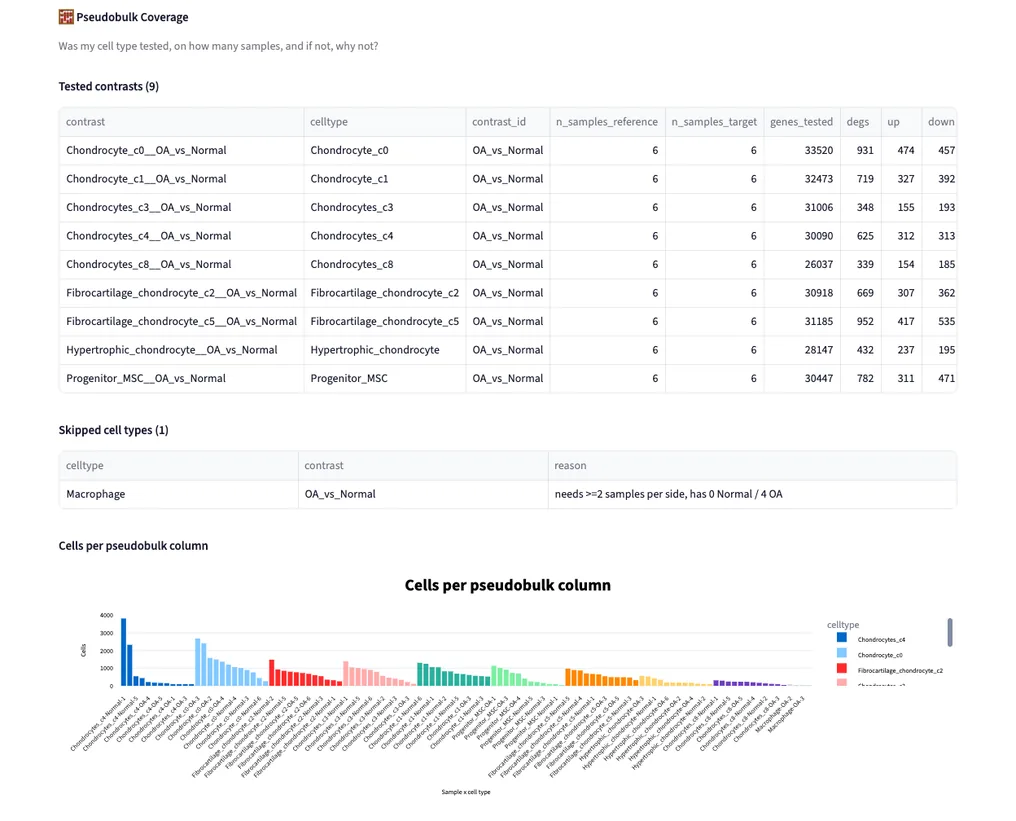
Example output from the sample project.
Tested Contrasts
An expandable table, with a count in its heading, lists every cell-type contrast that was successfully run:
| Column | Meaning |
|---|---|
contrast |
the full contrast name, cell type included |
celltype |
cell type tested |
contrast_id |
the contrast, e.g. OA_vs_Normal |
n_samples_reference / n_samples_target |
samples contributing to each side |
genes_tested |
genes passing expression filters in this cell type |
degs / up / down |
significant genes in total and by direction |
Skipped Cell Types
The companion table lists what was not tested and states the reason for each — for example, a cell type recorded as "needs >=2 samples per side, has 0 Normal / 4 OA". A cell type absent from your differential expression results should be found here; if it is, the cause is coverage, not biology.
Cells per Pseudobulk Column
The chart shows how many cells went into every sample × cell type column, coloured by cell type and sorted from largest to smallest. It is the depth check behind each result: a pseudobulk profile built from a handful of cells is noisy, so a striking result whose columns sit at the far right of this chart deserves more caution than one whose columns sit at the left.