Cell Atlas — UMAP Overview
Header: 🗺️ Cell Atlas
Available on single-cell RNA-seq projects.
The Cell Atlas tab answers: what does the atlas look like, and where does each sample sit in it? It is the map of the whole experiment — every cell placed by its expression profile, so related cells sit together.
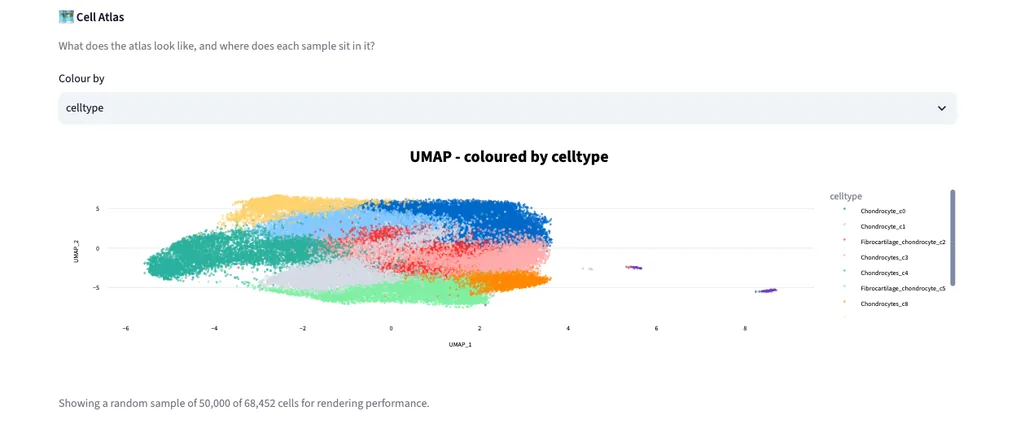
Example output from the sample project.
The UMAP
The plot shows a UMAP embedding with one point per cell, on axes labelled UMAP_1 and UMAP_2. Cells with similar expression profiles are placed near one another; distinct groups appear as separate islands. UMAP axes have no units and the distance between two clusters carries no quantitative meaning — read the grouping, not the geometry.
Colour by
The Colour by dropdown above the plot recolours the same embedding without recomputing it. Colouring by celltype shows what each region is; recolouring by sample or condition answers a different question — whether a region is shared across your samples or driven by just one of them. A cluster present in a single sample is usually a batch effect rather than biology.
The legend on the right lists the values of whichever field you have chosen.
Sampling for Performance
Large experiments are drawn from a random subset of cells so the plot stays responsive, and a caption below the plot says so explicitly — for example, "Showing a random sample of 50,000 of 68,452 cells for rendering performance." The subset is for display only: every downstream statistic is computed on all cells.