Gene Trend — Expression Across Conditions
Header: Gene Trend: Expression Profile Across Conditions
The Gene Trend report plots how one or more selected genes change across ordered condition groups, as line charts.
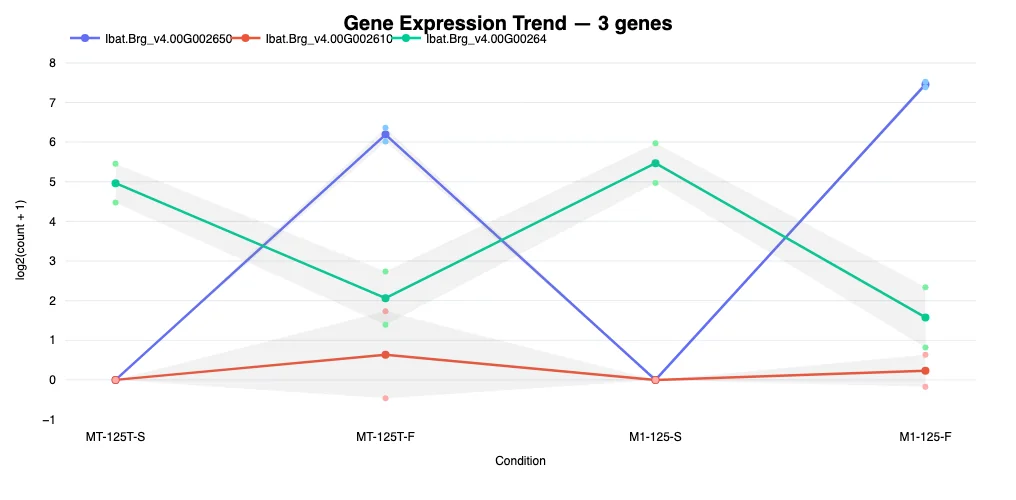
Example output from the sample project.
What It Shows
- Mean ± SD expression per condition group for each selected gene.
- Optional individual sample points overlaid on the trend line.
- An optional log2 scale toggle for the y-axis.
Select genes with the sidebar filters or the report's own selector to build the comparison.
When to use it
Use Gene Trend to visualize trajectories — how specific genes rise or fall across a time-series or dose-response series. It is the per-gene, line-plot counterpart to the pattern-level Clustering report.