MA — Fold Change vs Mean Expression
Header: MA Plot: Mean Expression vs Fold Change
The MA plot displays every gene with its log2 Fold Change on the y-axis and its mean expression (log10 of DESeq2 baseMean) on the x-axis. This reveals whether fold changes depend on how strongly a gene is expressed.
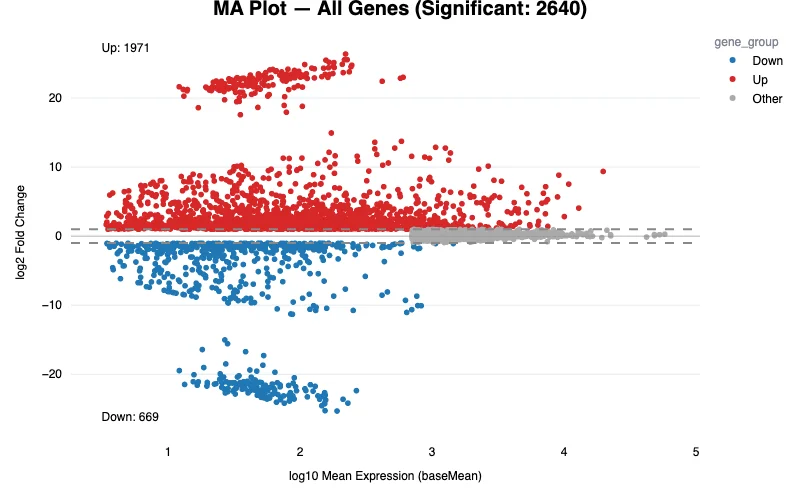
Example output from the sample project.
Reading the Plot
- Genes with large positive log2FC sit near the top, large negative near the bottom.
- Moving left to right shows increasing average expression across samples.
- Significant genes are colored using the Up/Down colors; non-significant genes are muted.
A well-behaved dataset shows fold changes roughly centered around zero across the full expression range. A fan shape at the low-expression (left) side is a common sign of noisy, low-count genes with inflated fold changes.
When to use it
Use the MA plot as a complement to the Volcano plot. Where Volcano emphasizes statistical significance, MA emphasizes abundance — reach for it to check for expression-dependent fold-change bias before trusting large fold changes from low-count genes.