Single-cell Figures — Publication Figure Gallery
Header: 🖼️ Single-cell Figures
Available on single-cell RNA-seq projects.
The Single-cell Figures tab collects the static figures produced by the single-cell pipeline, rendered at 300 DPI for publication and presentation use. A caption at the top states how many were generated for your project.
It is a gallery rather than a report, and is not one of the 29 — those are the interactive tabs.
These are fixed images, not interactive plots: they do not respond to the sidebar filters. When you need to change a threshold and watch the result move, use the interactive tabs — Cell Atlas, DEG by Cell Type, Cell Composition — and come here when you need a figure at print resolution.
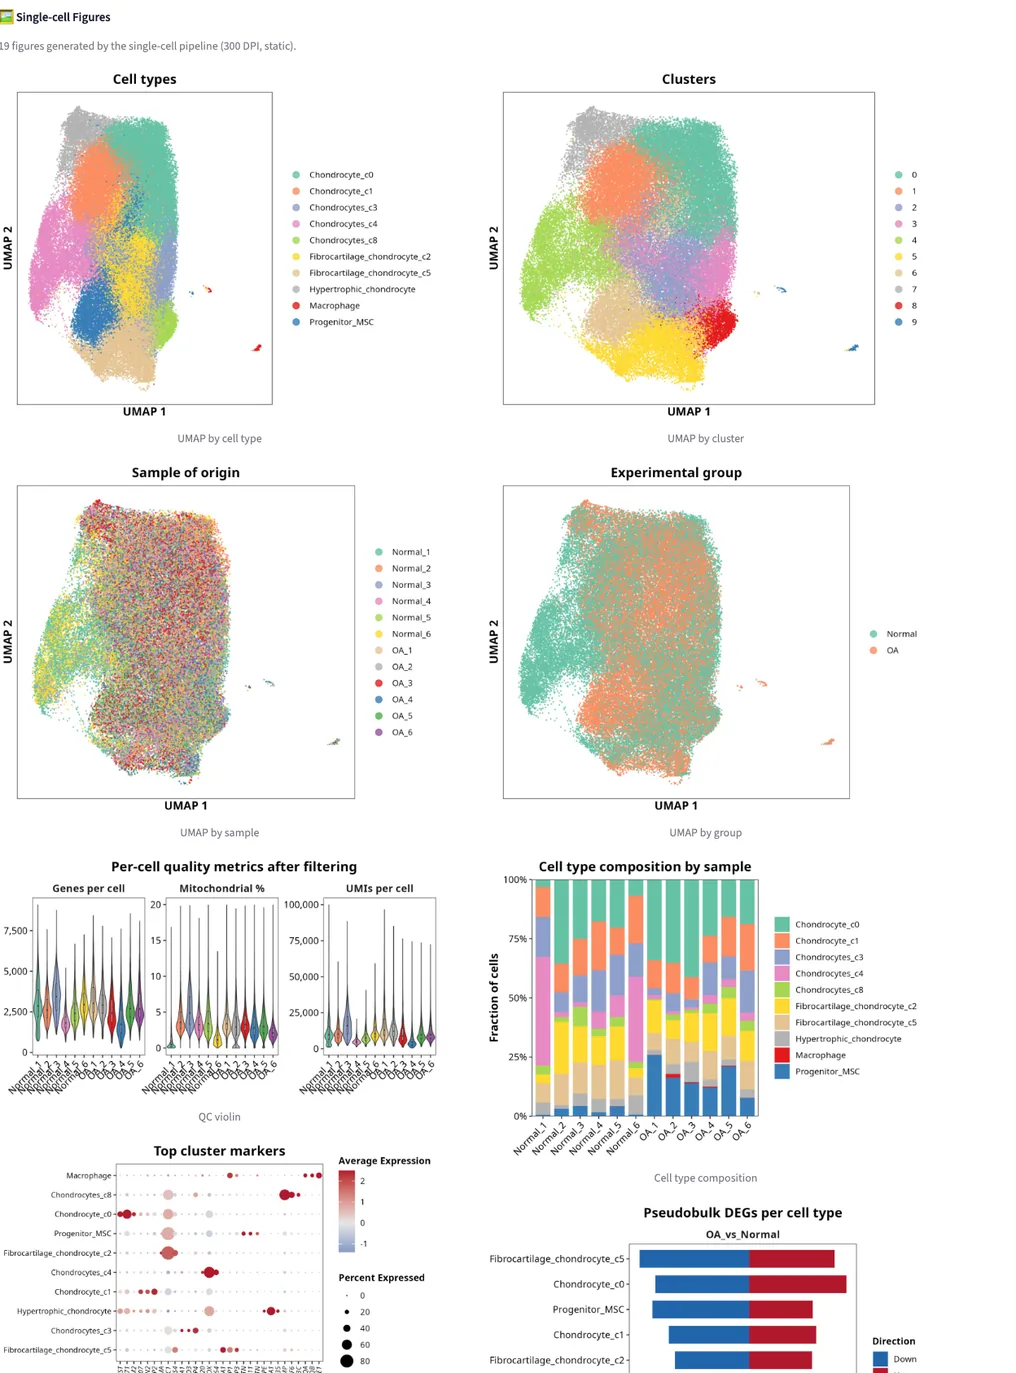
Example output from the sample project.
What the Gallery Contains
The figures fall into four groups:
- Atlas views — UMAP by cell type, by cluster, by sample, and by group. The same embedding coloured four ways.
- Quality control — a QC violin summarising per-cell quality across samples.
- Composition and markers — a marker dot plot and a cell type composition figure.
- Per-cell-type results — one volcano plot for each cell type tested, named for its cell type and contrast (for example, Volcano — Chondrocyte_c0__OA_vs_Normal), plus GO and KEGG enrichment figures and a DEG bar plot.
The number of volcano plots therefore follows the number of cell types that were successfully tested — Pseudobulk Coverage explains why a given cell type may be missing from the gallery.