Clustering — Dose-Response / Time-Series Patterns
Header: Clustering: Dose-Response / Time-Series Expression Patterns
The Clustering report groups genes by their expression pattern across samples using K-means clustering on Z-score normalised expression (VST or normalised counts). Instead of asking "which genes changed," it asks "which genes change together."
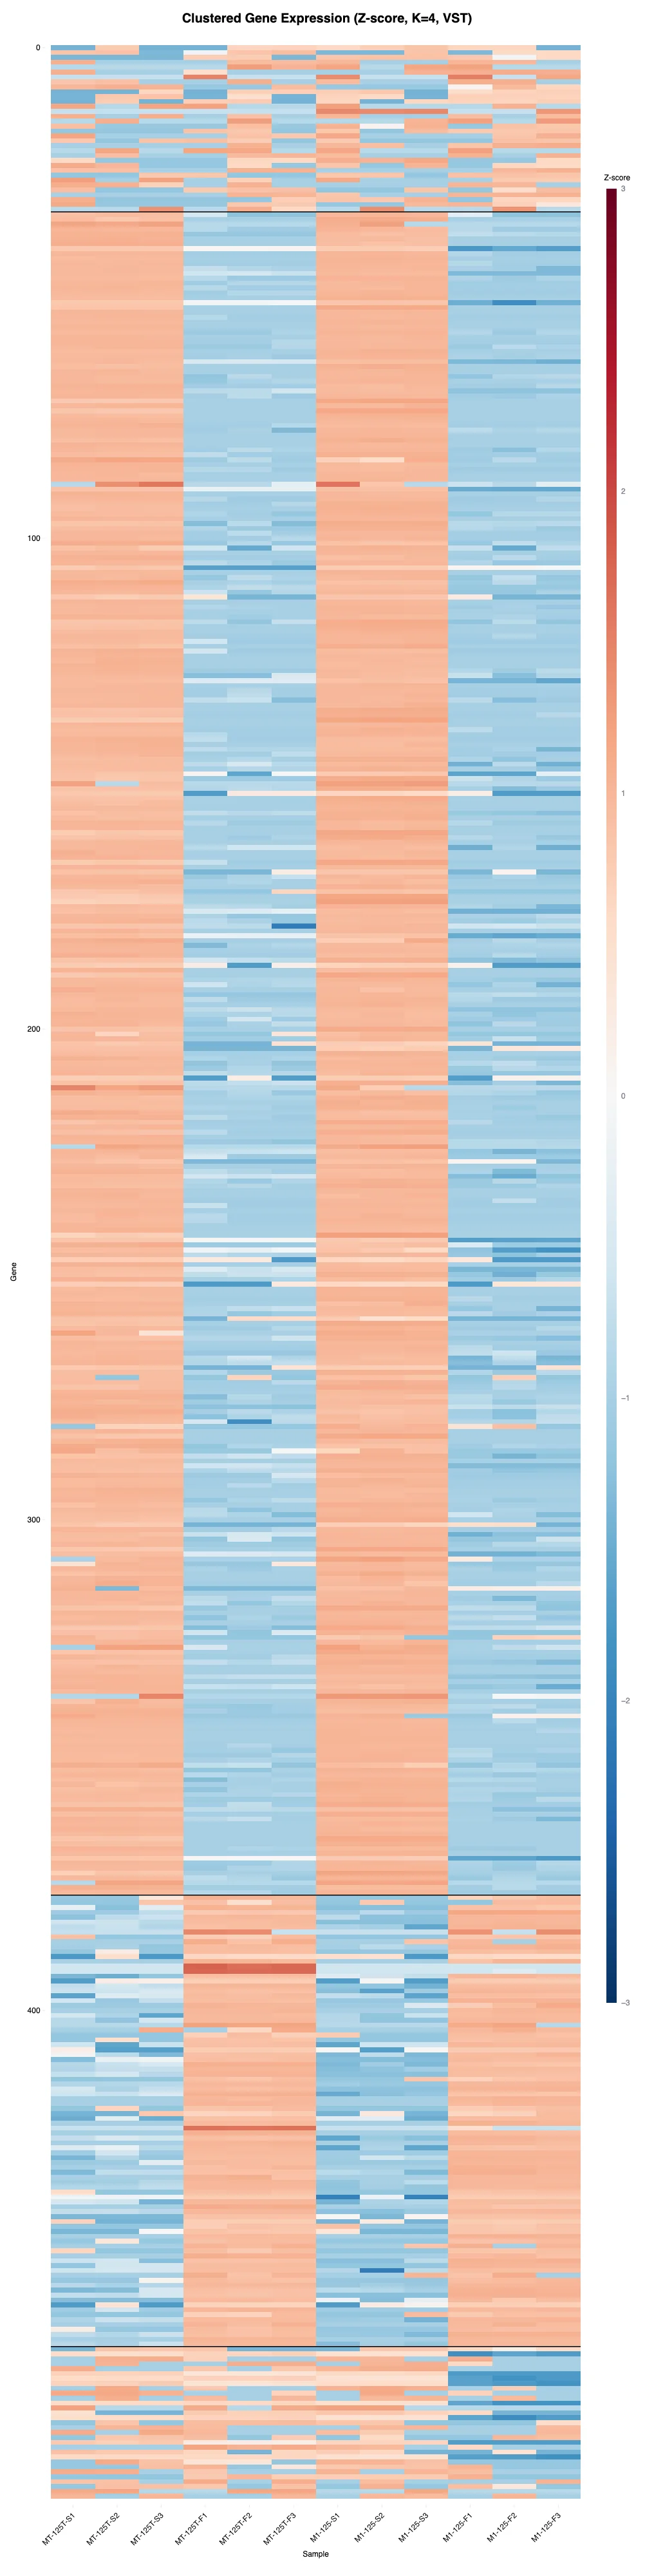
Example output from the sample project.
What It Shows
- Clustered heatmap — genes grouped into K clusters by expression profile.
- Per-cluster profiles — mean ± SD expression line for each cluster, grouped by condition, so you can see the shape of each cluster's response.
- Membership table — which genes belong to each cluster, with a CSV download.
- Elbow plot — total within-cluster variance vs K, to help you choose a sensible number of clusters.
Controls
- Cluster count (K) — 2 to 15.
- Max genes — 50 to 2000 top genes by variance (higher = more complete, slower).
When to use it
Ideal for time-series or dose-response experiments. Use it to group genes into shared response profiles — e.g., monotonically increasing, transient, or late-responding — and download each cluster's gene list for downstream analysis. Check the elbow plot first to pick K.