Cell QC — Barcodes to Cells
Header: 🧪 Cell QC
Available on single-cell RNA-seq projects.
The Cell QC tab answers a single question: how much of your sequencing survived, per sample? It traces every sample from raw barcodes through cell calling, quality filtering, and doublet removal, so you can see where cells were lost before any biology is interpreted.
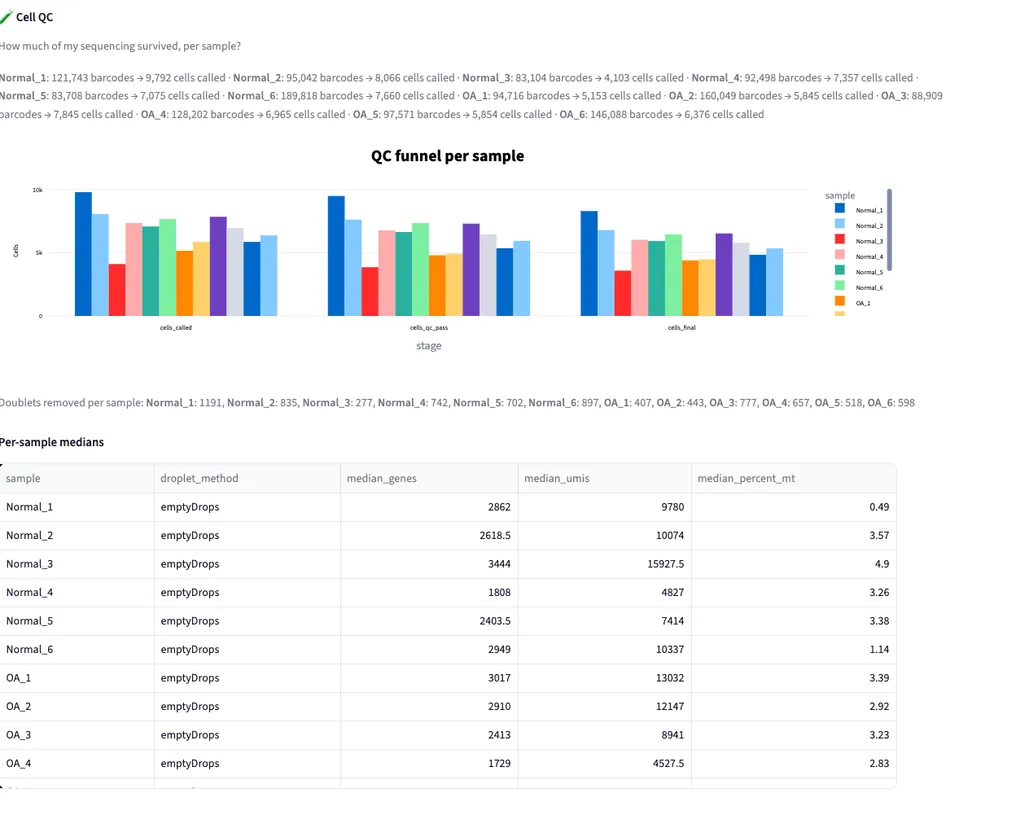
Example output from the sample project.
Barcode Summary
A summary line at the top reports, for every sample, how many barcodes were observed and how many cells were called from them — for example, "Normal_1: 121,743 barcodes → 9,792 cells called". A large gap between the two numbers is normal: most barcodes are empty droplets.
QC Funnel per Sample
The main chart shows each sample at three stages, so the drop-off between them is visible at a glance:
- cells_called — barcodes judged to contain a cell
- cells_qc_pass — cells surviving the quality filters
- cells_final — cells remaining after doublet removal
The legend on the right identifies samples by color. A sample that falls much further than its peers between two stages is the one to investigate.
Doublets Removed
Below the funnel, a line reports how many doublets were removed from each sample. Doublets are droplets that captured two cells and would otherwise appear as a spurious intermediate cell type.
Per-Sample Medians
An expandable table gives the per-sample quality medians:
| Column | Meaning |
|---|---|
droplet_method |
how cells were called from barcodes (e.g. emptyDrops) |
median_genes |
median genes detected per cell |
median_umis |
median UMIs (transcript counts) per cell |
median_percent_mt |
median percentage of mitochondrial reads per cell |
A low median_genes or a high median_percent_mt relative to the other samples points to stressed or dying cells in that sample.