Upset — Multi-Contrast Intersections
Header: Upset Plot: Multi-Contrast DEG Intersections
The Upset report shows how differentially expressed genes overlap across many contrasts at once. It is the modern alternative to a Venn diagram when you have more comparisons than a Venn can clearly display.
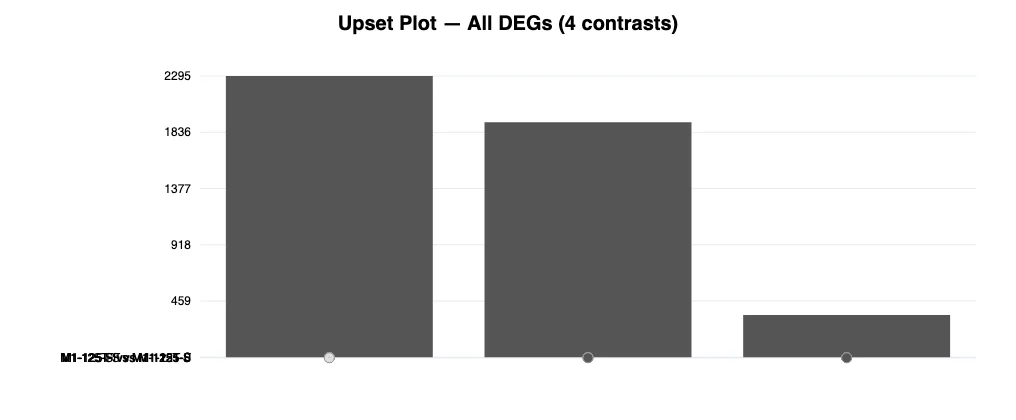
Example output from the sample project.
Reading the Plot
- A bar chart shows the size of every intersection (how many genes fall into each combination of contrasts).
- A dot matrix below the bars indicates which contrasts participate in each intersection.
- Bars are sorted so the largest intersections are easy to spot.
Works for any number of contrasts (2+), and stays readable where Venn diagrams break down.
When to use it
Use Upset when comparing 5 or more contrasts, or any time a Venn diagram would be too cluttered. It answers "which combinations of conditions share DEGs, and how many?" For 2–4 contrasts, Venn is often more intuitive.