Cell Composition — Cell Type Proportions
Header: 🧱 Cell Composition
Available on single-cell RNA-seq projects.
The Cell Composition tab answers: does the mix of cell types shift with condition? Differential expression asks what changes within a cell type; this asks whether the tissue itself is made of different proportions.
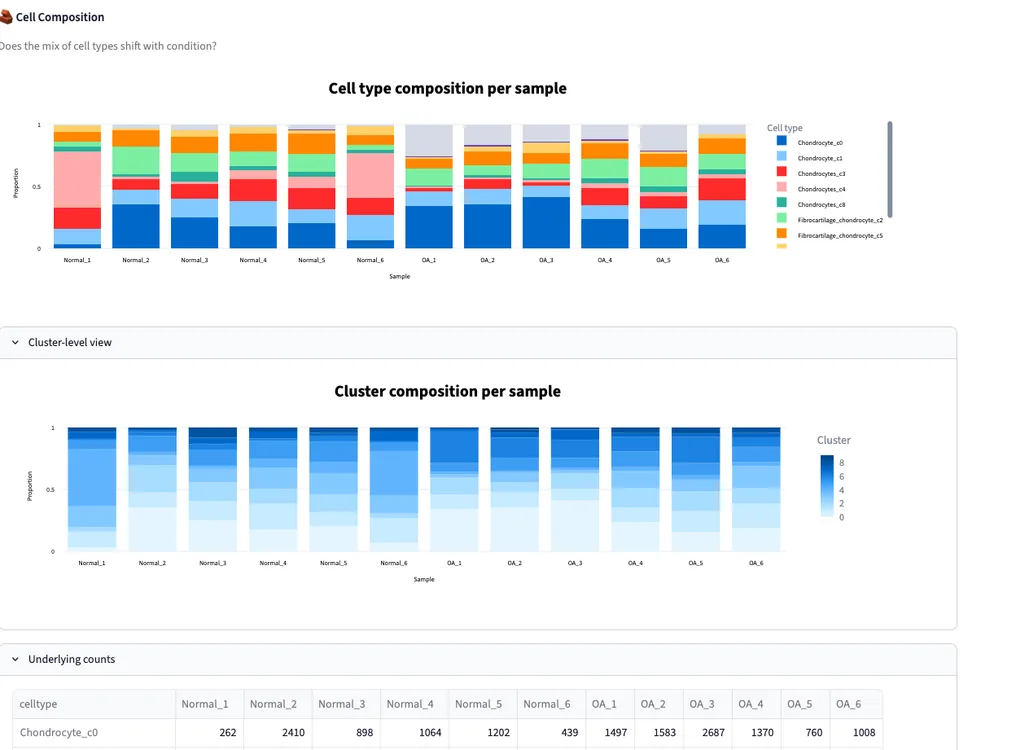
Example output from the sample project.
Cell Type Composition per Sample
The main chart is a stacked bar per sample, each bar summing to 1. The height of a band is that cell type's proportion of the sample, not its cell count, so samples of different sizes can be compared directly. The legend on the right identifies cell types by color.
Read it by comparing the same band across the two condition groups. A band that is consistently taller on one side is a compositional shift; one that varies as much within a group as between groups is not.
Cluster-level View
An expandable section repeats the same chart using clusters instead of named cell types. This is the version to check when several clusters were given the same label — it shows whether they behave alike, and whether the composition shift is driven by one cluster or spread across them.
Underlying Counts
A second expandable section gives the raw numbers behind the proportions: one row per cell type, one column per sample, with the cell count in each. Use it when a proportion looks dramatic — a band that doubles is much less interesting if it went from 8 cells to 16.