Hub Network — Hub Genes & Ego-Networks
Header: Hub Gene Network Visualization
The Hub Network report identifies the most connected genes in a co-expression network and lets you inspect the neighborhood around any one of them.
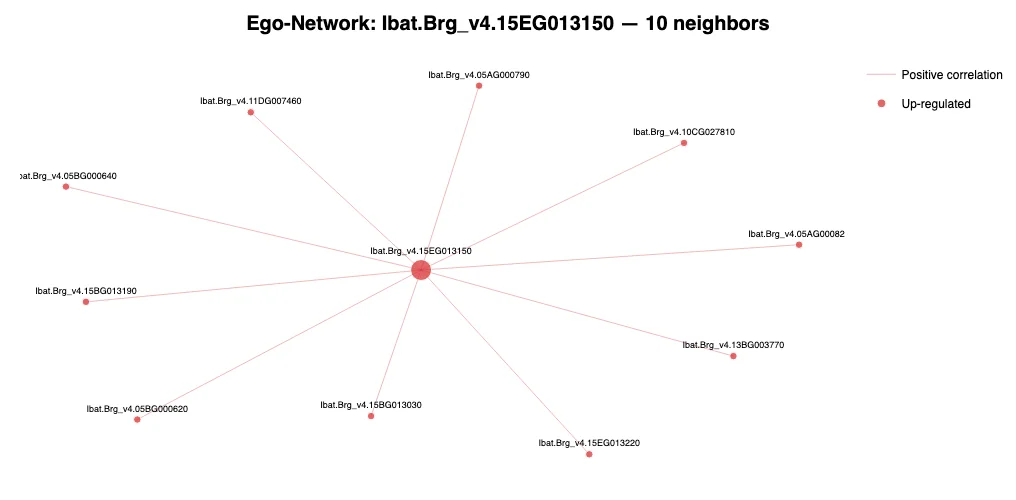
Example output from the sample project.
What It Does
- Builds a co-expression network from normalised counts (no external API required).
- Ranks genes by weighted degree (connectivity) to surface candidate hub genes.
- Renders a focused ego-network around a selected hub — its direct neighbors, the correlation edges connecting them, and the hub's expression and functional details.
Node size, label color, and edge color follow the sidebar Appearance settings.
When to use it
Use Hub Network to find likely key regulators or markers — genes that are highly co-expressed with many others — and to explore their immediate co-expression neighborhood. Pair it with Co-expression for the full network view.