
RNA-seq differential expression without code
Differential expression is the workhorse of RNA-seq — and, traditionally, the point where biologists hit a wall of R scripts. Here is what the analysis actually involves, and how to run it end to end without writing code.
What “differential expression” means
Differential expression (DE) analysis asks a simple question: which genes change between two conditions — treated vs. control, mutant vs. wild-type, disease vs. healthy? The output is a ranked list of genes, each with a fold change and a significance value, plus figures that summarize the pattern.
The standard pipeline
Whether you code it or not, a bulk RNA-seq DE analysis follows the same steps:
- Quality control of the raw sequencing reads (FASTQ).
- Quantification — align reads to a reference genome or transcriptome and count how many land on each gene.
- Normalization — correct for differences in sequencing depth and composition so samples are comparable.
- Statistical testing — fit a model (typically DESeq2 or edgeR, using a negative-binomial distribution) to find genes that change more than expected by chance.
- Multiple-testing correction — adjust p-values across all genes (Benjamini–Hochberg / FDR).
- Interpretation — volcano and MA plots, PCA, heatmaps, and GO/KEGG enrichment to turn the gene list into biology.
Why it usually needs code
The gold-standard tools — DESeq2, edgeR, and the surrounding Bioconductor ecosystem — are R packages. Running them means installing R and its dependencies, writing a script to load counts and sample metadata, specifying the experimental design, calling the model, and then writing more code to produce every plot. It’s powerful and flexible, but a real barrier if R isn’t your daily tool — and every new question means new code.
Doing it without code
The steps don’t change — only who does them. A no-code platform runs the same DESeq2 pipeline and generates the same figures, driven by a point-and-click interface instead of a script. A typical no-code workflow looks like this:
- Start from a public accession or your own data — paste an NCBI GEO/SRA accession, or upload counts or FASTQ.
- Define the comparison by choosing which sample groups to contrast.
- Run the pipeline — normalization, DESeq2, and enrichment happen automatically.
- Explore the results in interactive reports, adjusting thresholds and reading the biology.
What you get out
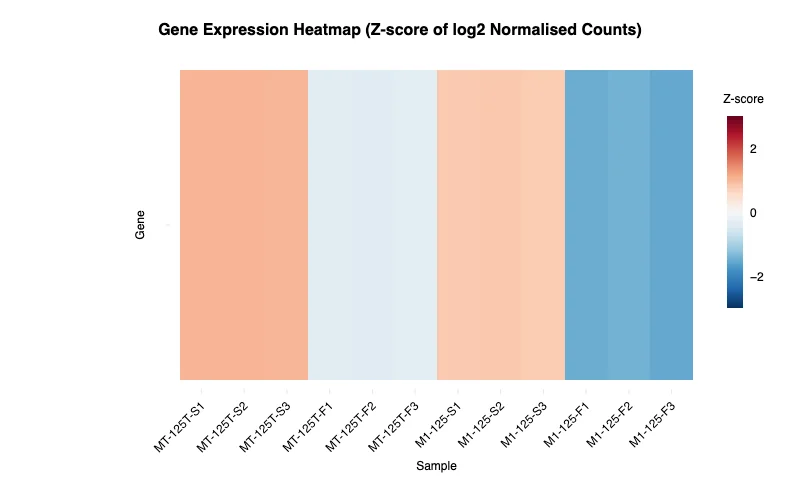
A complete DE analysis should leave you with a volcano plot and a filtered gene list, a PCA showing whether your groups separate, heatmaps of the top genes, and GO/KEGG enrichment connecting those genes to pathways. Read together, these answer not just which genes changed, but what it means.
Does no-code mean less rigorous?
No — as long as the platform uses the same established methods (DESeq2, proper normalization, FDR correction) and is transparent about them. What you trade away is fine-grained control over custom or non-standard designs. For the common case of standard bulk RNA-seq, a good no-code tool produces the same results, faster.
Liragen Insights runs exactly this pipeline — DESeq2 differential expression, GO/KEGG enrichment, and 29 linked reports with AI-written interpretation — entirely in the browser. See how it compares to coding it yourself →
Run a DE analysis without writing code
From an NCBI accession or your own data to decision-ready reports — in minutes.