From raw sequence to decision-ready insight — without writing a line of code.

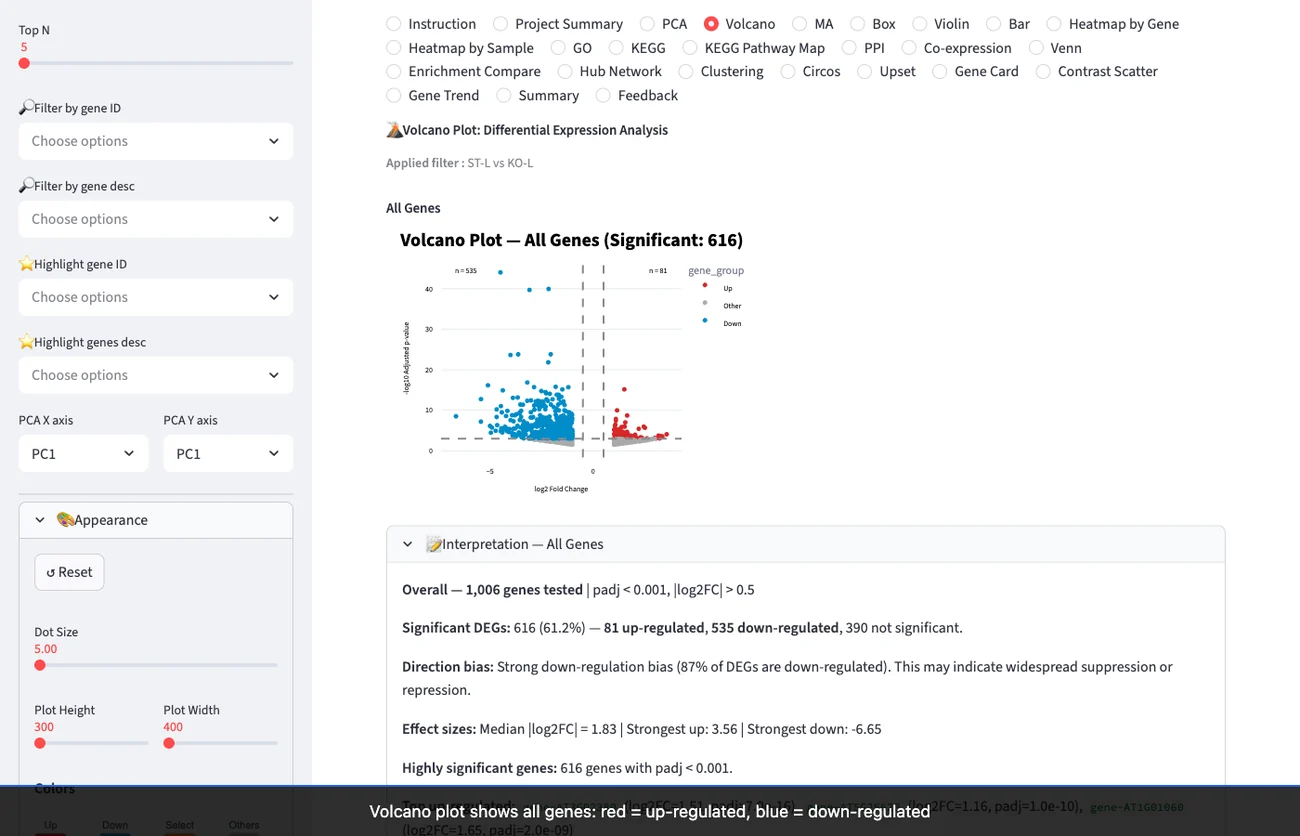
Liragen Insights: a Volcano report with an auto-generated interpretation of the differentially expressed genes.
22interactive reports
6analysis categories
0lines of code
100%browser-based

Works with your RNA-seq data: NCBI SRADESeq2GOKEGGSTRINGCo-expression

See it in action

See Liragen Insights in action

A quick look inside the app — exploring an interactive Volcano report in the browser, filter and read the results as you go.

insights.liragen.com

Why Liragen ?

Our Vision

To make the full power of genomics accessible to every researcher through technology and AI.

Our Mission

We accelerate genomics research by automating NGS analysis end to end — taking researchers from raw sequence to decision-ready insight with AI and scientific expertise.

How it works

From accession ID to answers — in three steps

No pipelines to install, no scripts to write. You point Insights at your data; it does the rest.

  1. 1

    Create or upload

    Start a project from an NCBI accession ID, or upload a sample sheet (Excel/CSV) for your own raw data. Annotate samples and define contrasts with an AI copilot.

  2. 2

    Automated pipeline

    Insights runs DESeq2 differential expression and GO/KEGG enrichment automatically — no command line, no environment setup.

  3. 3

    Explore & interpret

    Read your results across 22 interactive reports. Every chart writes its own interpretation and updates the moment you move a filter.

No coding required

You run the analysis. You don’t code it.

Pick a project and everything loads — accession, contrasts, the full sample sheet, downloadable results. Then filter with sliders and dropdowns: adjusted p-value, fold-change, top-N, gene search.

  • NCBI accession or your own raw-data upload
  • DESeq2 + GO/KEGG run automatically
  • Point-and-click filtering — nothing to install
Insights Project Summary screen: project name, NCBI accession, contrasts and sample-annotation tables, with report tabs across the top.
Project Summary — data loads the moment you pick a project.

AI-driven analysis

Every chart explains itself.

Not a generic, pre-written summary. Each report ships with an interpretation generated from your own results — your DEG counts, direction bias, effect sizes, and top genes by name — and it rewrites itself the instant you change a threshold. An AI Research Assistant is on hand for the deeper questions.

  • Plain-language interpretation on every report
  • Recomputes live as you filter
  • AI copilot for contrasts; AI Research Assistant on request
Volcano plot with an auto-generated interpretation panel summarizing 616 significant DEGs, direction bias and top genes.
Volcano report — 616 DEGs summarized automatically, top genes named.

22 reports, six analysis categories

Every Insights project ships with an interactive report suite spanning quality control to functional interpretation. Select any report to open its guide in the user manual.

Quality Control

Expression Patterns

Functional Enrichment

Multi-Contrast Overlap

Prefer to be shown?

Get a 15-minute walkthrough

Leave your email and we’ll set up a short call — your data, your questions, no slides. Nothing else required.

Rather write to us? Send a message.

Get started in three steps

From request to results — no software to install.

  1. 1 Sign up free Create your account at insights.liragen.com — no cost to start.
  2. 2 Create a project Enter an NCBI accession ID or upload your own raw data.
  3. 3 Explore your reports 22 interactive, AI-interpreted reports, right in your browser.